Note: In the event you got to this article from an older link, here is a link to the newest data for this category of monthly home sales in Kitsap County
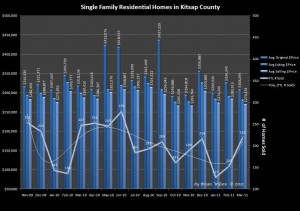
The line graph shows the total number of single family residential homes sold with a smooth trend line overlaid. The Bar Graphs, show the Average initial asking prices, the Average Price at which an offer was received and then the final Average Selling Price.
The good news is that the number of Homes Sold this March showed a significant increase from the previous 2 months, but were still 12% below the sales from March 2010.


Speak Your Mind