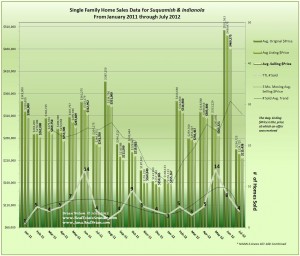
The volatility for home sales in Indianola & Suquamish certainly continued for the month of July with the number of homes sold and the average prices of those sales again cycling down, repeating a periodic trend that has been occurring for over two years. Looking ahead at the data for August, we see that closed sales by the third week of the month have already doubled the total sales for the month of July and there are an additional 16 Sales “Pending”. What does this all mean? The large swings in sales month-to-month make it difficult to predict any trend looking at the data for just one month. A larger time period needs to be considered and in doing this, we see that the trend is mixed but cyclical. This area has clusters of high end waterfront and view properties and other areas with a mixture of all types of homes. There is something for everyone here and I think some months we see more distressed sales and sales of modest homes while other months we see more sales of higher end homes, making it difficult to make any meaningful predictions. The thing that does show a trend is that the volatility in terms of the number of homes sold and prices has cycled on a periodic basis, which is interesting.
Thank you for visiting our blog.
Brian Wilson, Broker

19723 10th Ave NE; Suite 200
Poulsbo, WA 98370


Speak Your Mind