Go here for February 2012 data
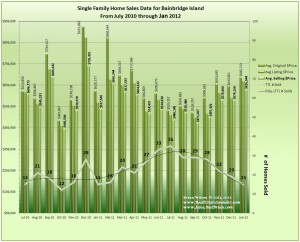
This graph shows 19 months of home sales and prices on Bainbridge Island, WA from July 2010 through January 2012. For each month the vertical bar graphs (going left to right) show the average initial asking price, the average price at which an offer was received and the average selling price.
The number of homes sold during January 2012 were the same as the number sold during January of the previous year, however; the average selling prices were more than 14% higher than the same period one year ago! Home prices have been steadily increasing on Bainbridge Island for the past 5 months and during the past month, sales of distressed properties decreased from the previous month to only 20% of the sales, which may have been a factor for the increasing average selling prices. Another factor impacting the increasing average selling prices is the increasing number of higher priced properties being sold. It’s also important to consider that the final sales price could have additional credits from the Seller to the Buyer, and any of these credits are not reflected in the data provided.
In summary, it appears the Bainbridge Island Real Estate market is stabilizing with respect to the number of homes selling, which are reflecting a consistent seasonal pace. In terms of average prices, there has been steady and significant appreciation in average home selling prices on Bainbridge Island, which has been a trend for the past 5 months, and appears to be continuing.
Stay tuned for next months data and let us know your thoughts in the comment section below….
Thank You,
Brian Wilson, Broker
John L. Scott – Poulsbo


Speak Your Mind