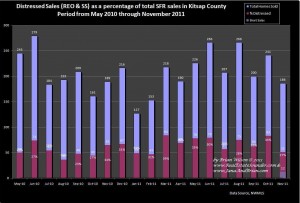
Distressed home sales (Bank Owned & Short Sales) in Kitsap County for 18 months, through November 2011
(For the most recent data, go here )
As you can see on the graph, for the month of November, there was a 7% decrease in distressed property sales in Kitsap County, from 34% of total homes Sold, down to 27%. I don’t believe there have been any fundamental improvements to account for this decrease, and I fully expect to see the percentages increase and trend up in future months.
Beginning with the November data, I am showing the number of Short Sales that comprise the distressed properties Sold. So now you can quickly and easily determine the number and percentage that Short Sales comprise of the total amount of distressed homes sold. Of course, you can also then quickly infer the percentage of distressed properties that are Bank Owned Sales. With respect to distressed property sales, the data for Kitsap County has been closely echoing the National trends.
Data from DSNews and other sources indicate a swelling shadow inventory of Bank Owned foreclosed properties. The shadow inventory are properties that have been foreclosed but are just sitting on the banks books and have not yet been put on the market for sale. The other factor which implies a significant ongoing inventory of Bank Owned properties are the latest reports indicating that while new defaults (borrowers who are late with their mortgage payments) have decreased slightly, actual foreclosures hit an all time high last month. So, it appears the bank owned inventory of foreclosed homes is growing faster than they are selling them.
We hope you find this information helpful and we welcome any of your comments below. We’d like to know your thoughts about our Blog, the market or anything Real Estate related.
Thank You for Visiting,
Brian & Jana, Broker & Managing Broker
John L. Scott Real Estate – Poulsbo


Speak Your Mind